Correct scaling of multiple diagrams
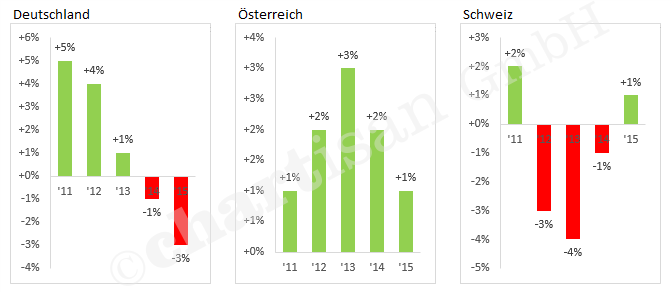
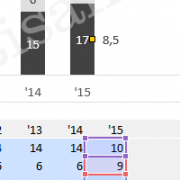
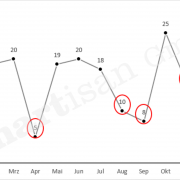
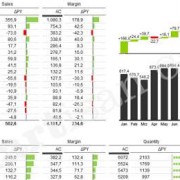
In many cases it is important to allocate data to multiple diagrams so the presentation is clear. It results in so-called Small-Multiple illustrations.
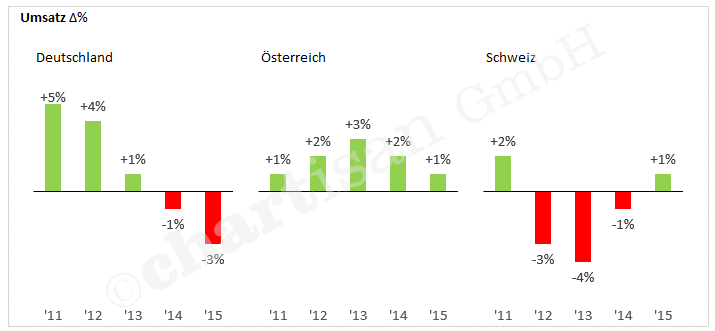
If each single diagram uses its own scale, the informative value of the entire page will get lost. In terms of a high quality visualisation, unitary scales are very important. At the same time the diagrams should be of low-maintenance and dynamic.
This challenge can be managed in Excel with our today´s small trick:
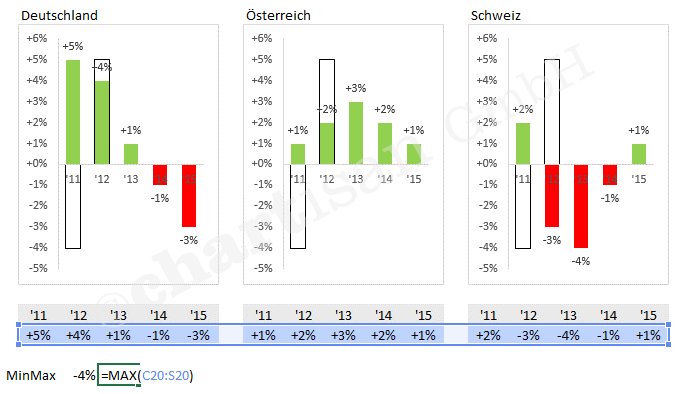
- Calculate the minimum and maximum of all (!) single values (function MIN and MAX)
- Insert into each single diagram the minimum and maximum values as an extra data stream
- Invisibly format the minimum and maximum data stream (no filling, no frame line)
- Align diagrams of same size next to each other
(keep holding the alt-key when pulling the mouse; then your diagrams lock with the segments)
Done 🙂

